
REAL Stock Investing Case Study

Hi, I'm Wade Bartlett. I developed the REAL Stock Investing Strategy to effectively generate market-beating returns. You'll see that the case study returns beat the market returns, 19.89% vs 11.04%.
I've personally used this strategy to earn returns greater than the long-term stock market returns.
With so many people claiming it's impossible to beat the market, I knew I had to do a case study to demonstrate REAL Stock Investing Strategy effectiveness.
REAL Stock Investing is based on timeless investing principles from some of the greatest investors, like Warren Buffett and Peter Lynch.
Not only have great investors beat the market for many years, the REAL Stock Investing Strategy has too, as shown in this case study.
Interested in the REAL Stock Investing course?
Click here to join the priority notification list!What are REAL Stocks?
REAL Stocks are stocks that meet stringent quality criteria of the REAL Stock Investing Strategy that I developed. The criteria is so stringent that after evaluating over 1,000 stocks, only 20-30 stocks met the criteria. These are the stocks I consider to be the cream of the crop, the very best for generating market-beating returns over the long-term. REAL is an acronym:
Return on capital
Earnings growth
Advantages
Low debt

Case Study Stock Selection
The REAL criteria is intentionally stringent to select only the best stocks most likely to outperform the market. For the case study, I chose 10 stocks, plus a bonus one, for a total of 11 stocks.
To be included in the case study, it must:
- Have met REAL Stock quality criteria at the time of the case study
- Have at least 15 years of financial data publicly available
- Be easily bought/sold (i.e., in a major stock exchange such as NYSE or NASDAQ, no over-the-counter dealer networks)
- Have met REAL Stock Investing Strategy buying criteria in the case study period
- Be a USA based company
- Not be a financial services company (e.g., not a bank, asset manager, insurance company, etc.)
- Must be a stock I would comfortably own at the time of the case study

Case Study Method
The case study was conducted as follows for each stock:
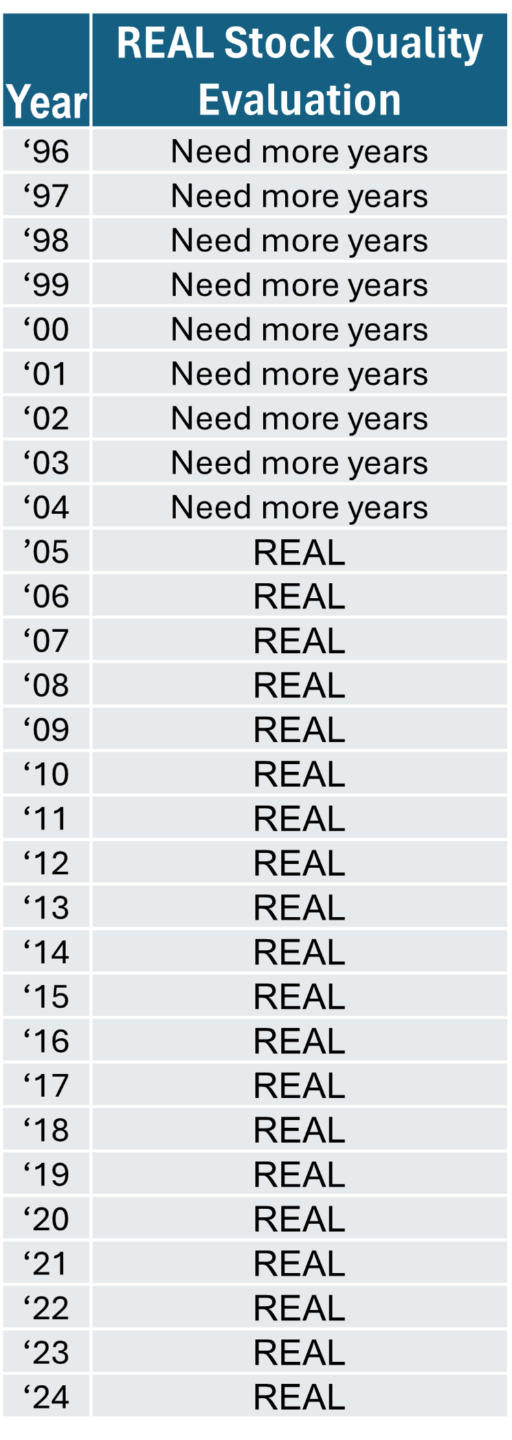
- All financial reports available through the SEC website were used as reference, going back as far as 1996.
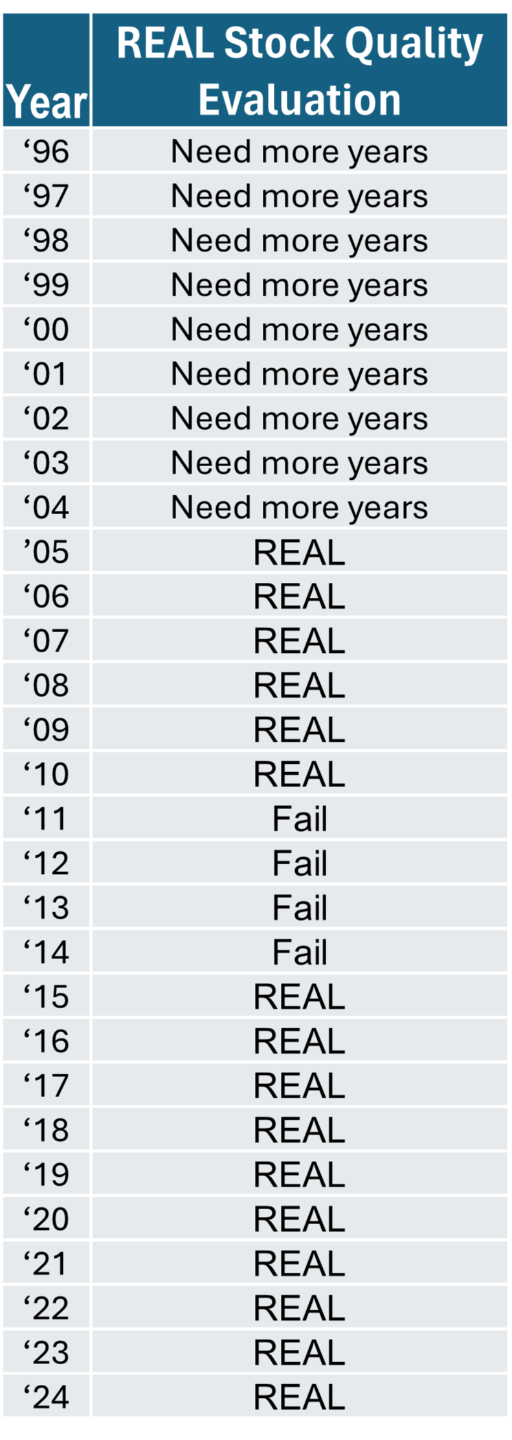
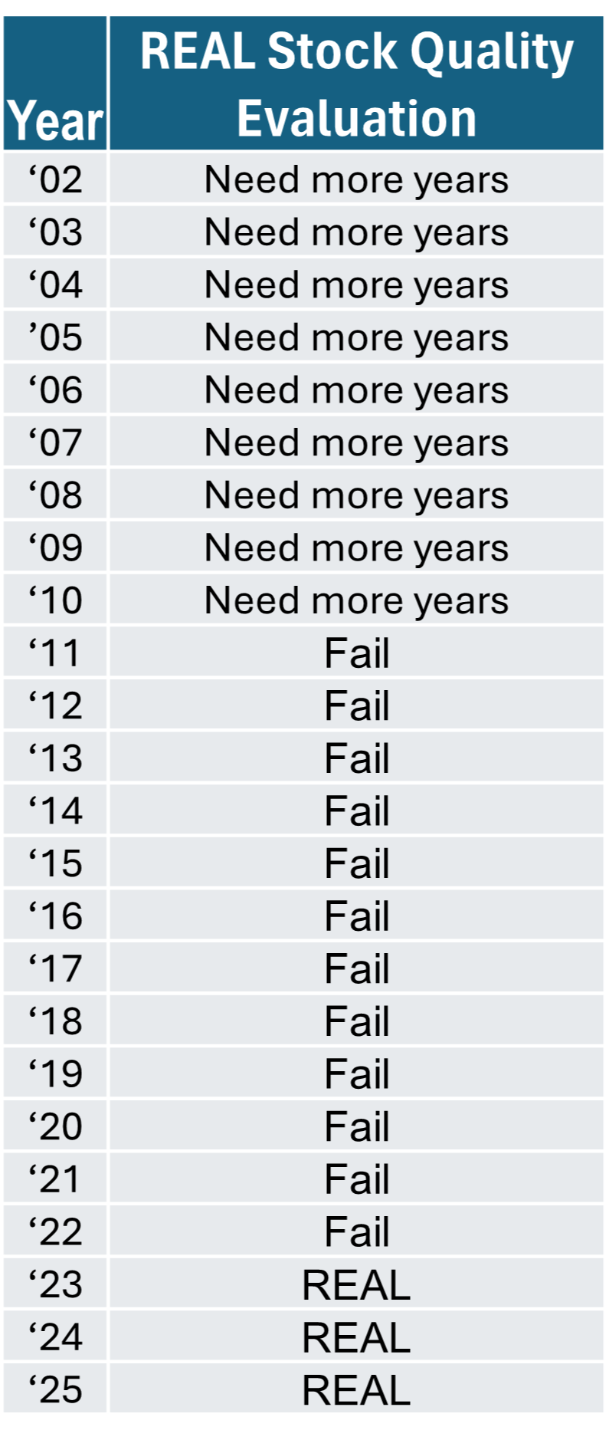
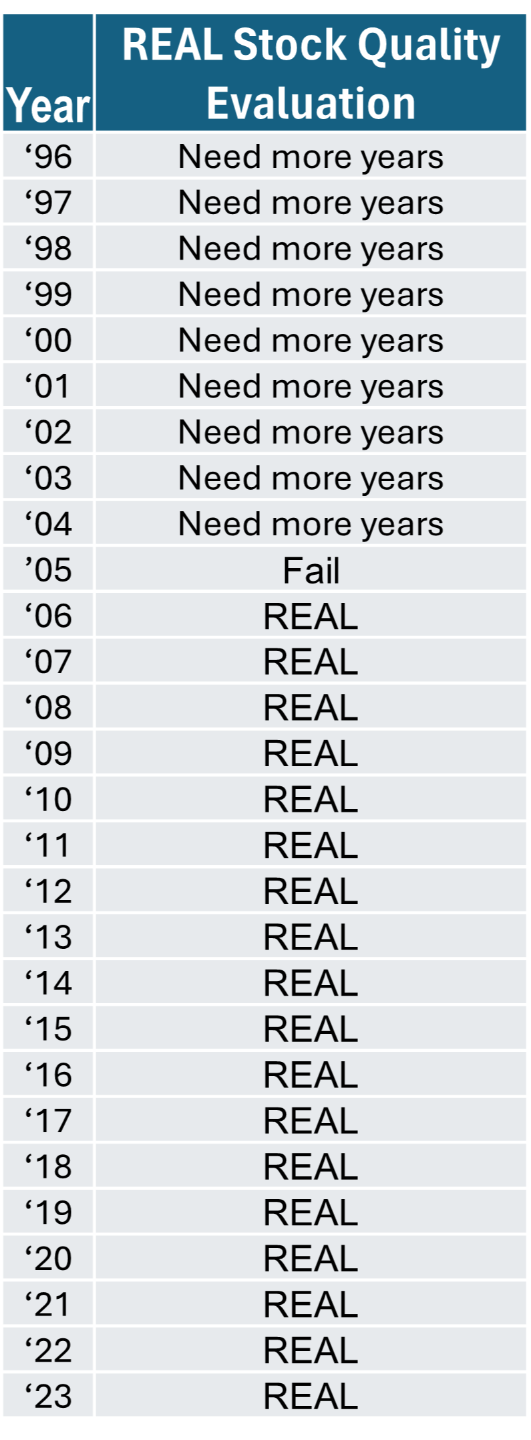
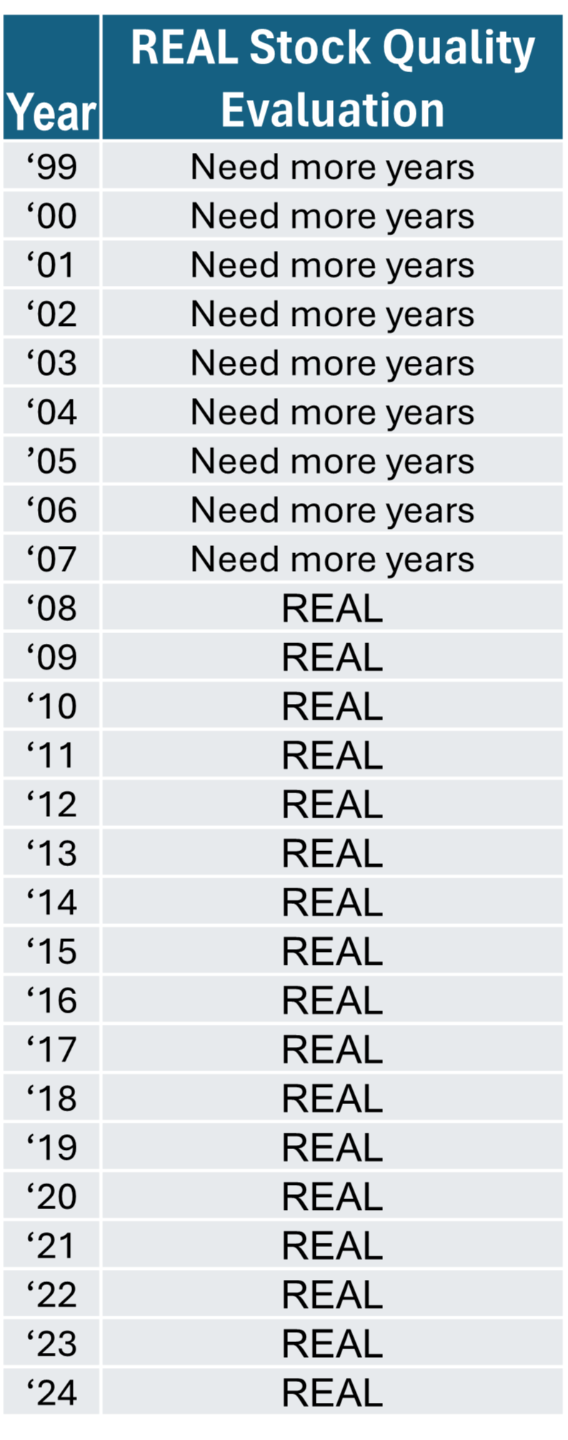
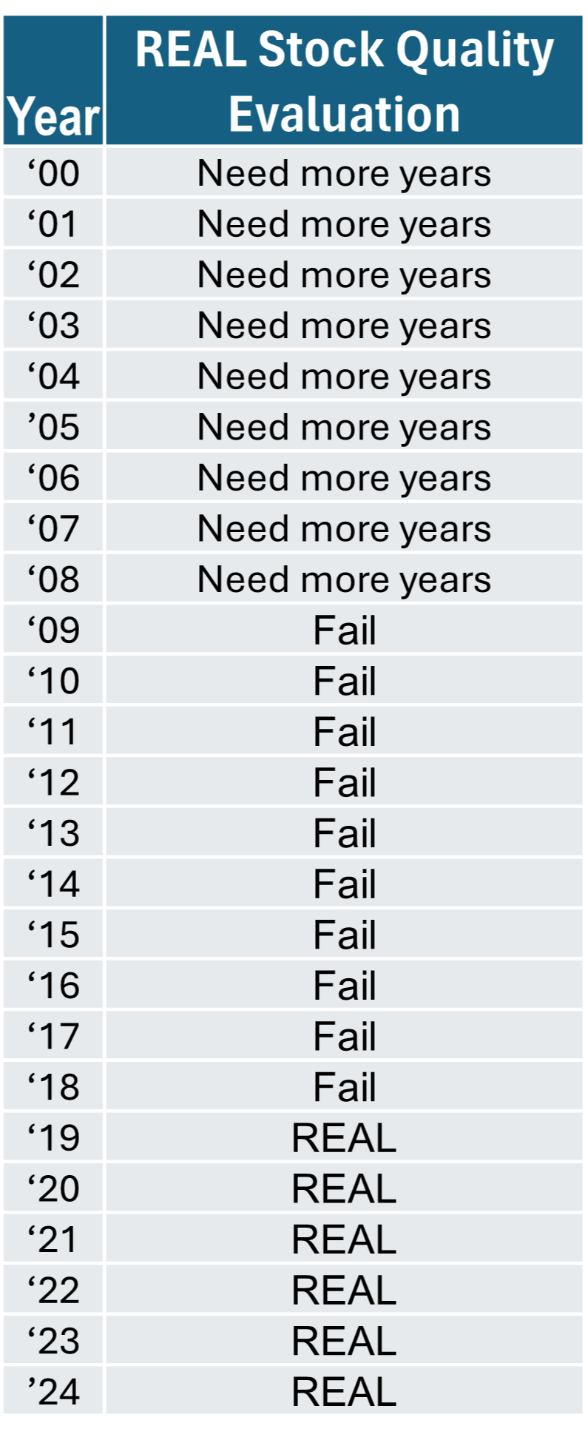
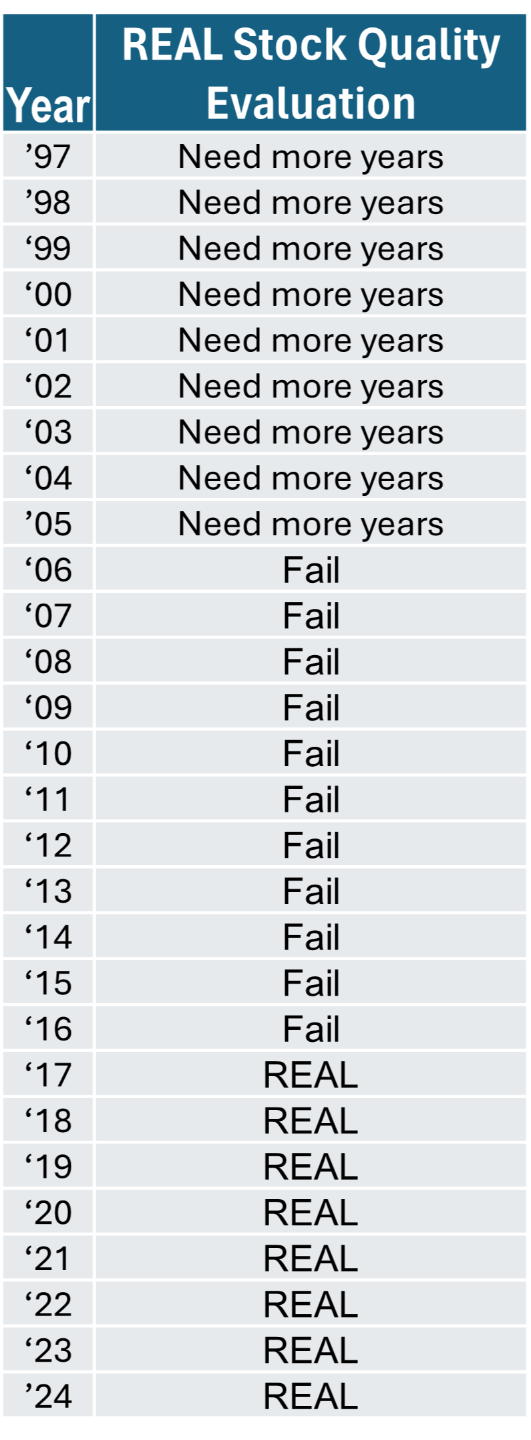
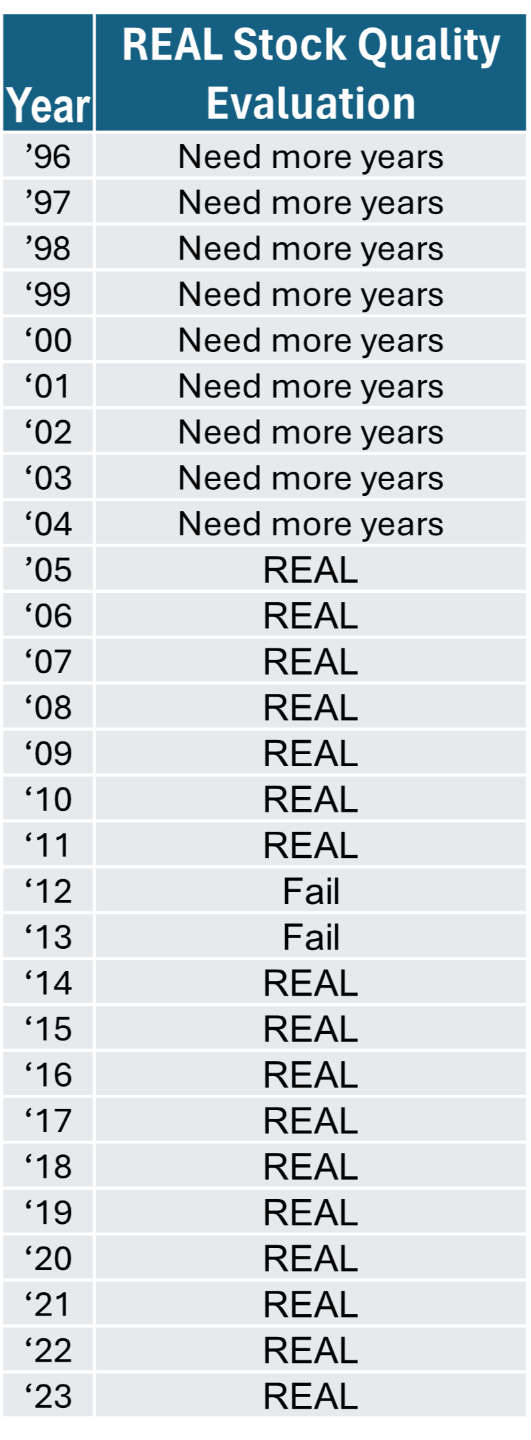
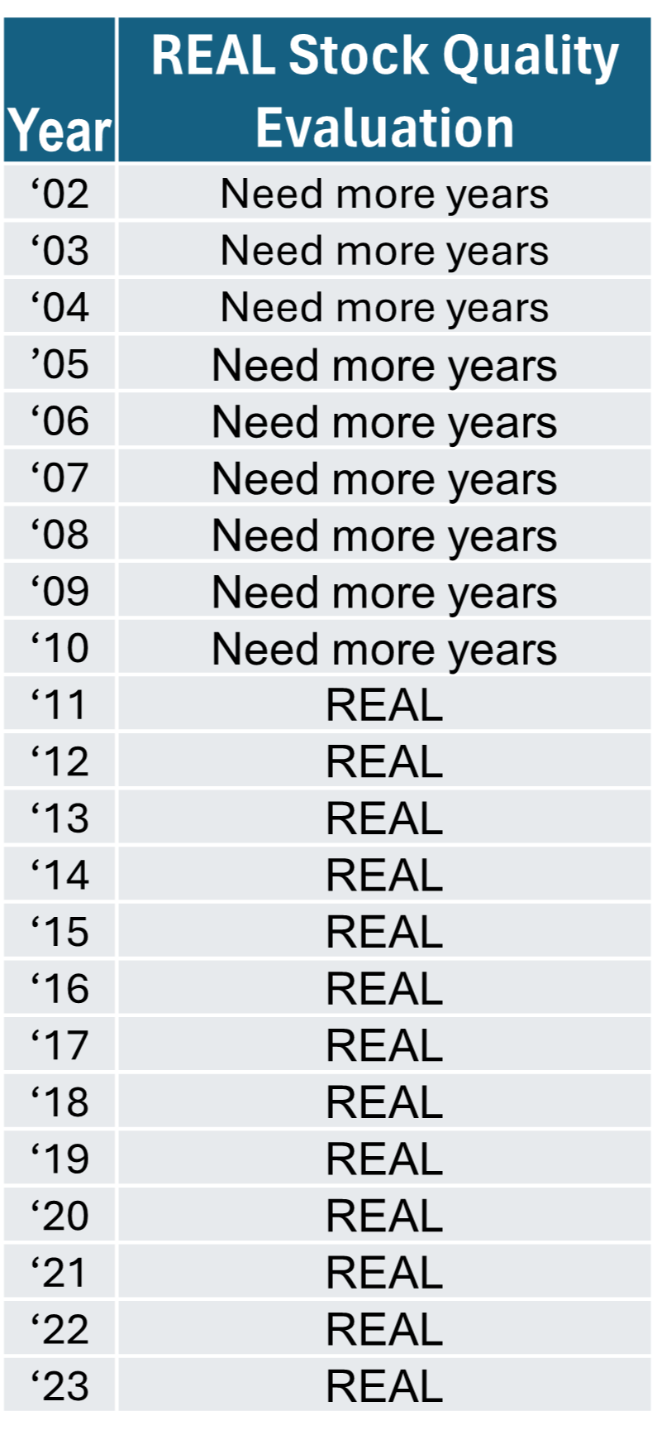
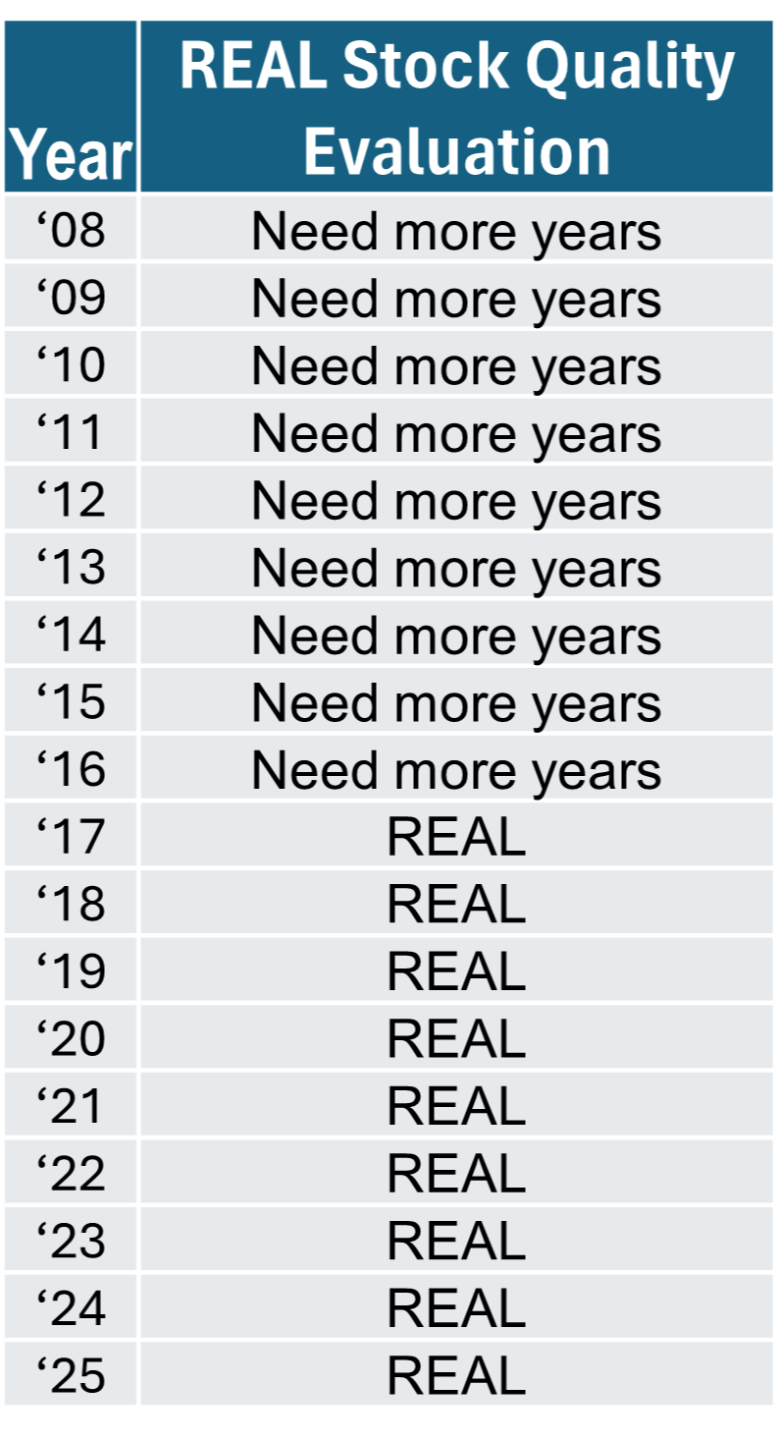
- The oldest 10 years of financial data were used to determine if the stock met REAL Stock quality criteria initially for the 10th oldest year
- Subsequently, the stock was re-evaluated each year to see if it still met REAL Stock quality criteria
- Historical daily price data was obtained
- If the stock met REAL Stock quality criteria AND REAL Stock Investing Strategy price criteria for that day, a share was bought
- Each day was checked to see if the stock met REAL quality and price criteria. If it did, a share was bought
- If the stock failed REAL Stock quality criteria, it was immediately sold and was not repurchased until it met REAL Stock Investing criteria again
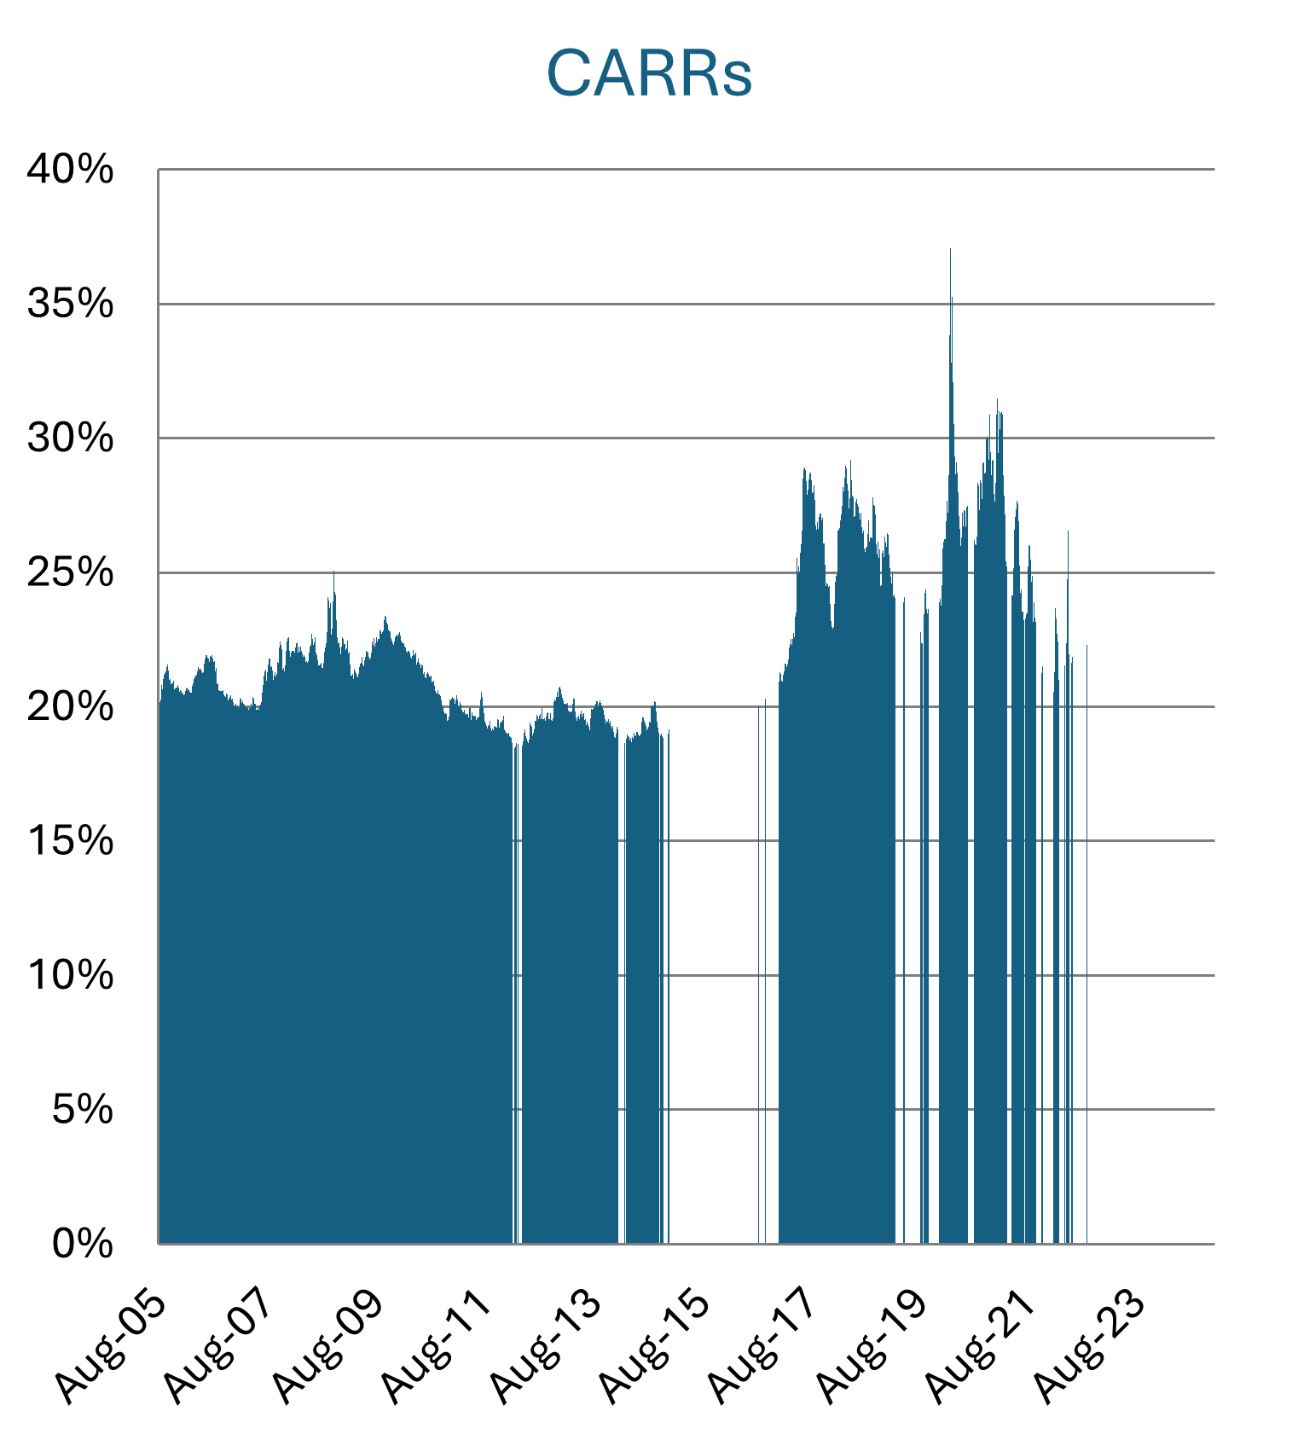
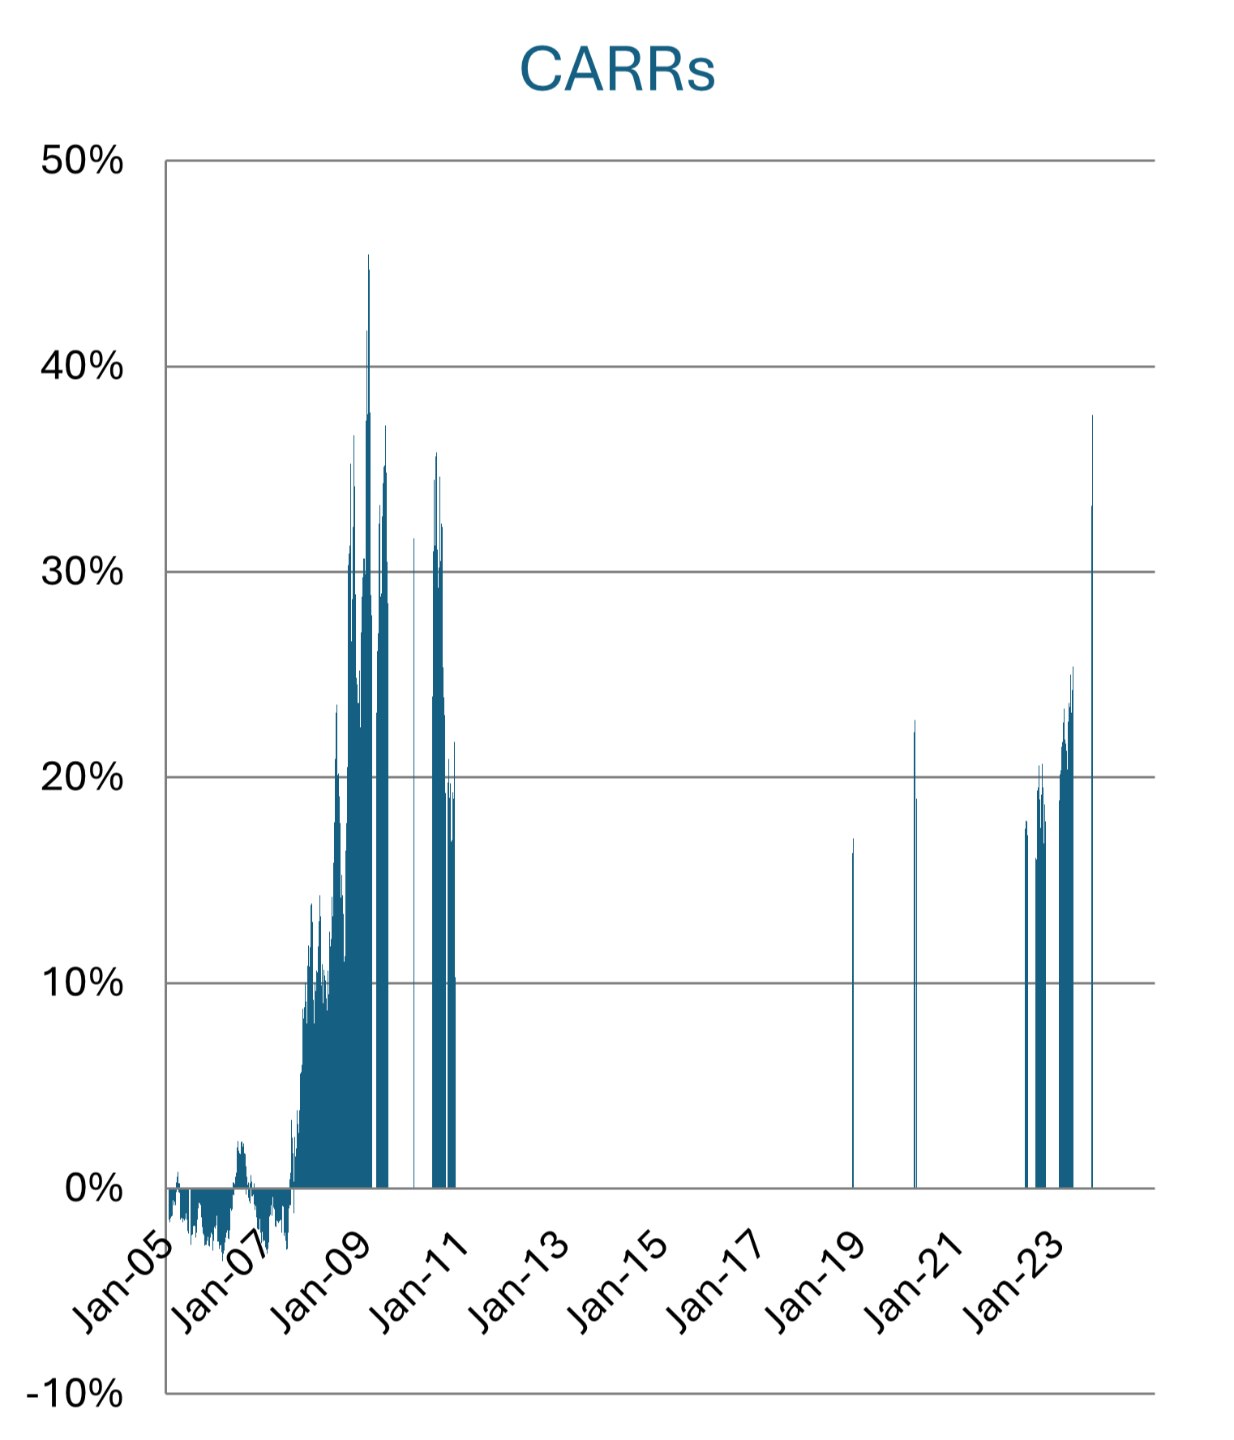
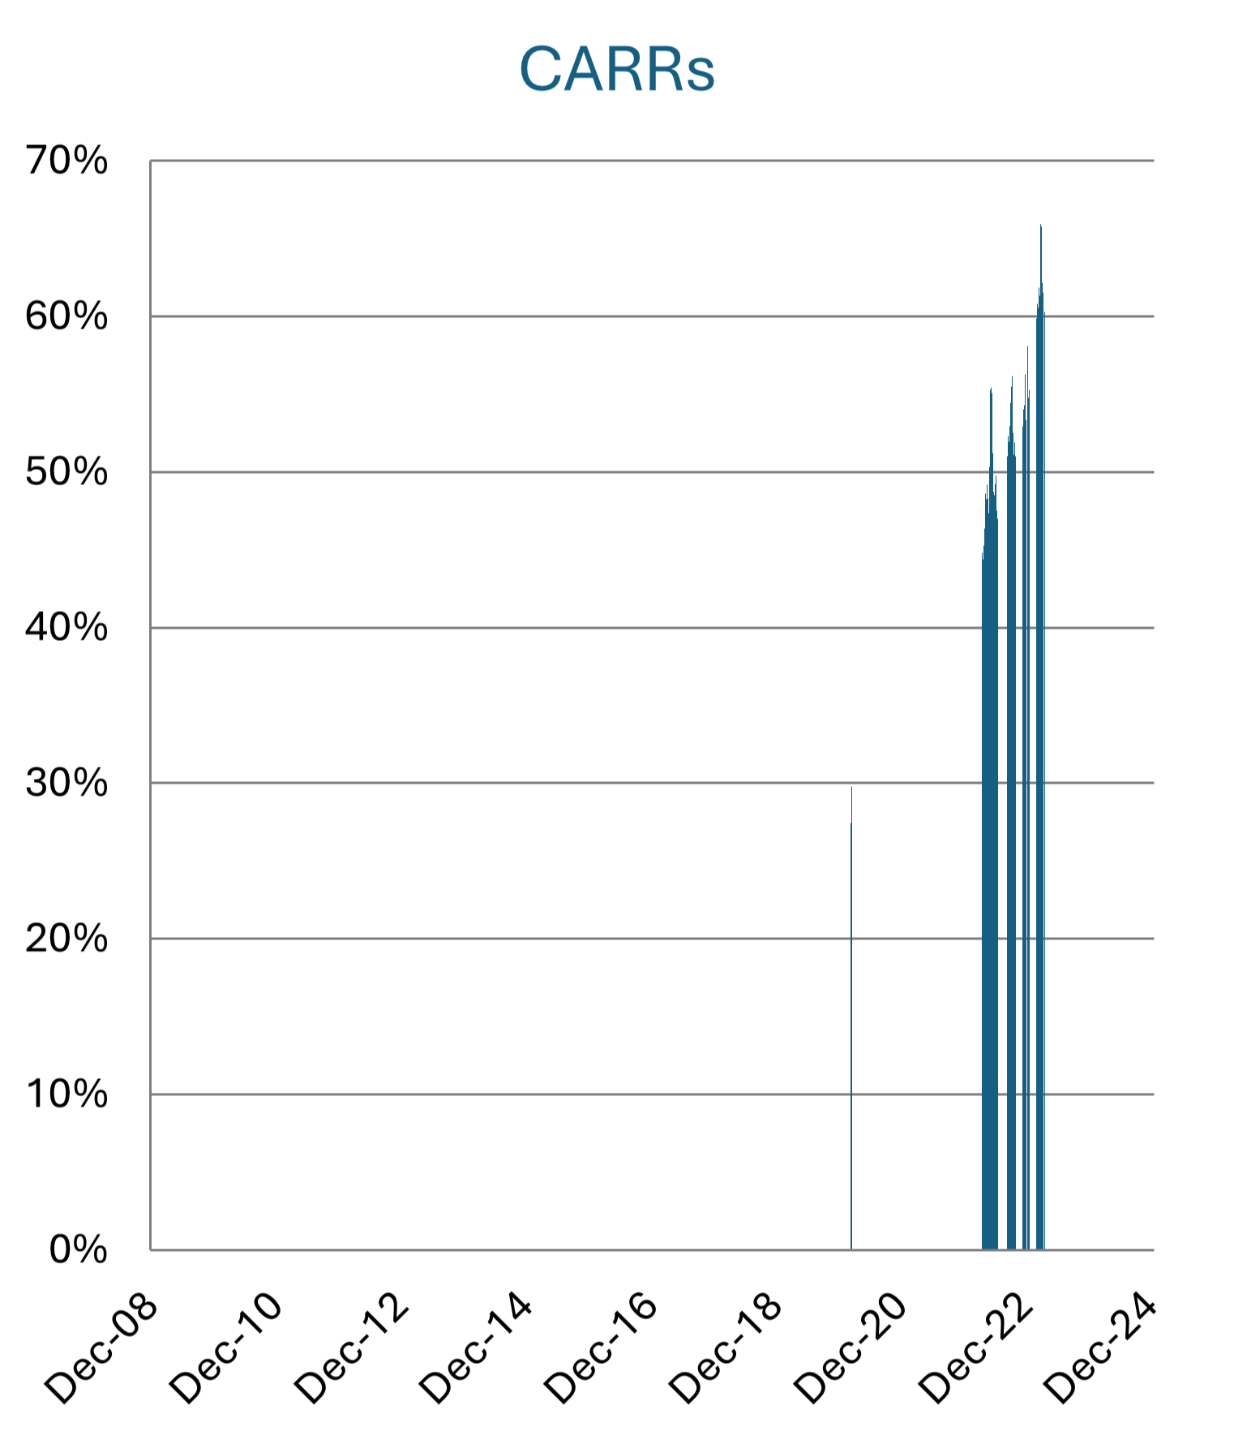
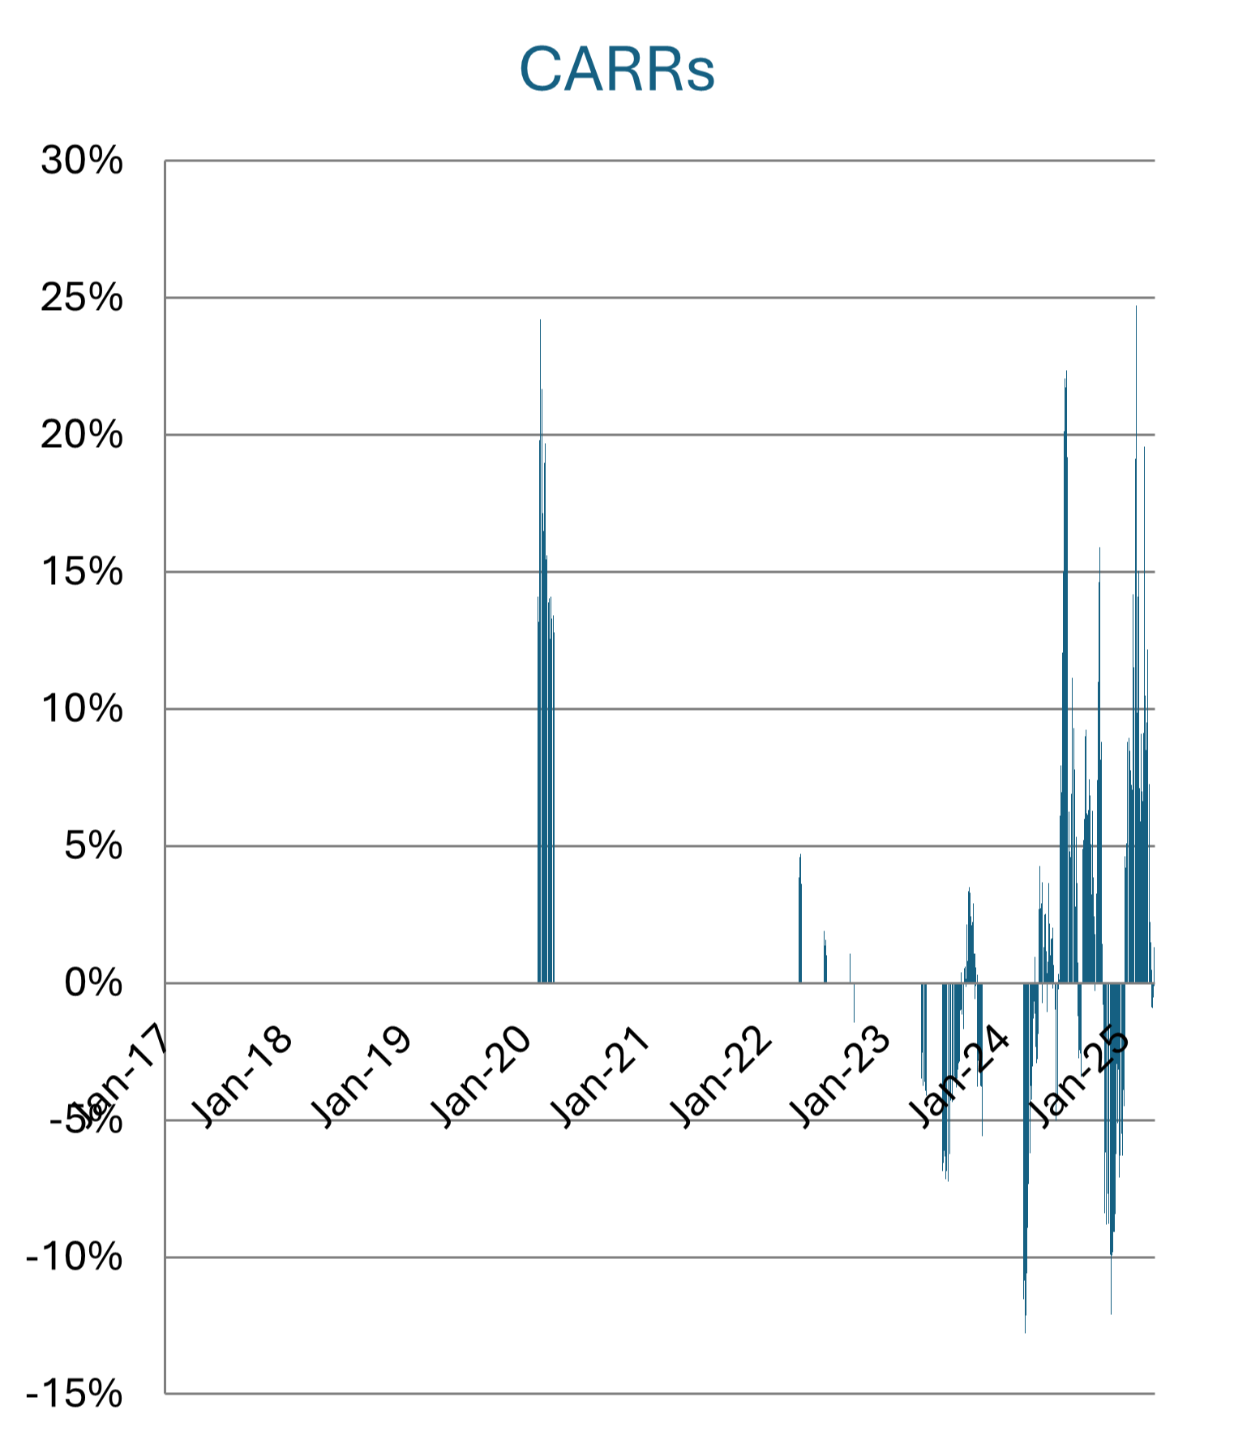
- For each day a share was bought, the compounding annual return rate (CARR) was calculated using the price for the day it was bought and the price at the end of the case study. The CARR is a way of measuring what the annual return rate was for the period. This is covered more in the REAL Stock Investing course.
- The CARR was also calculated for each day of the case study for the S&P 500 (an index often used to measure market performance)
- Performance of the REAL Stock purchases was compared to the respective S&P 500 purchases of the same days
REAL Stock Case Study Summary
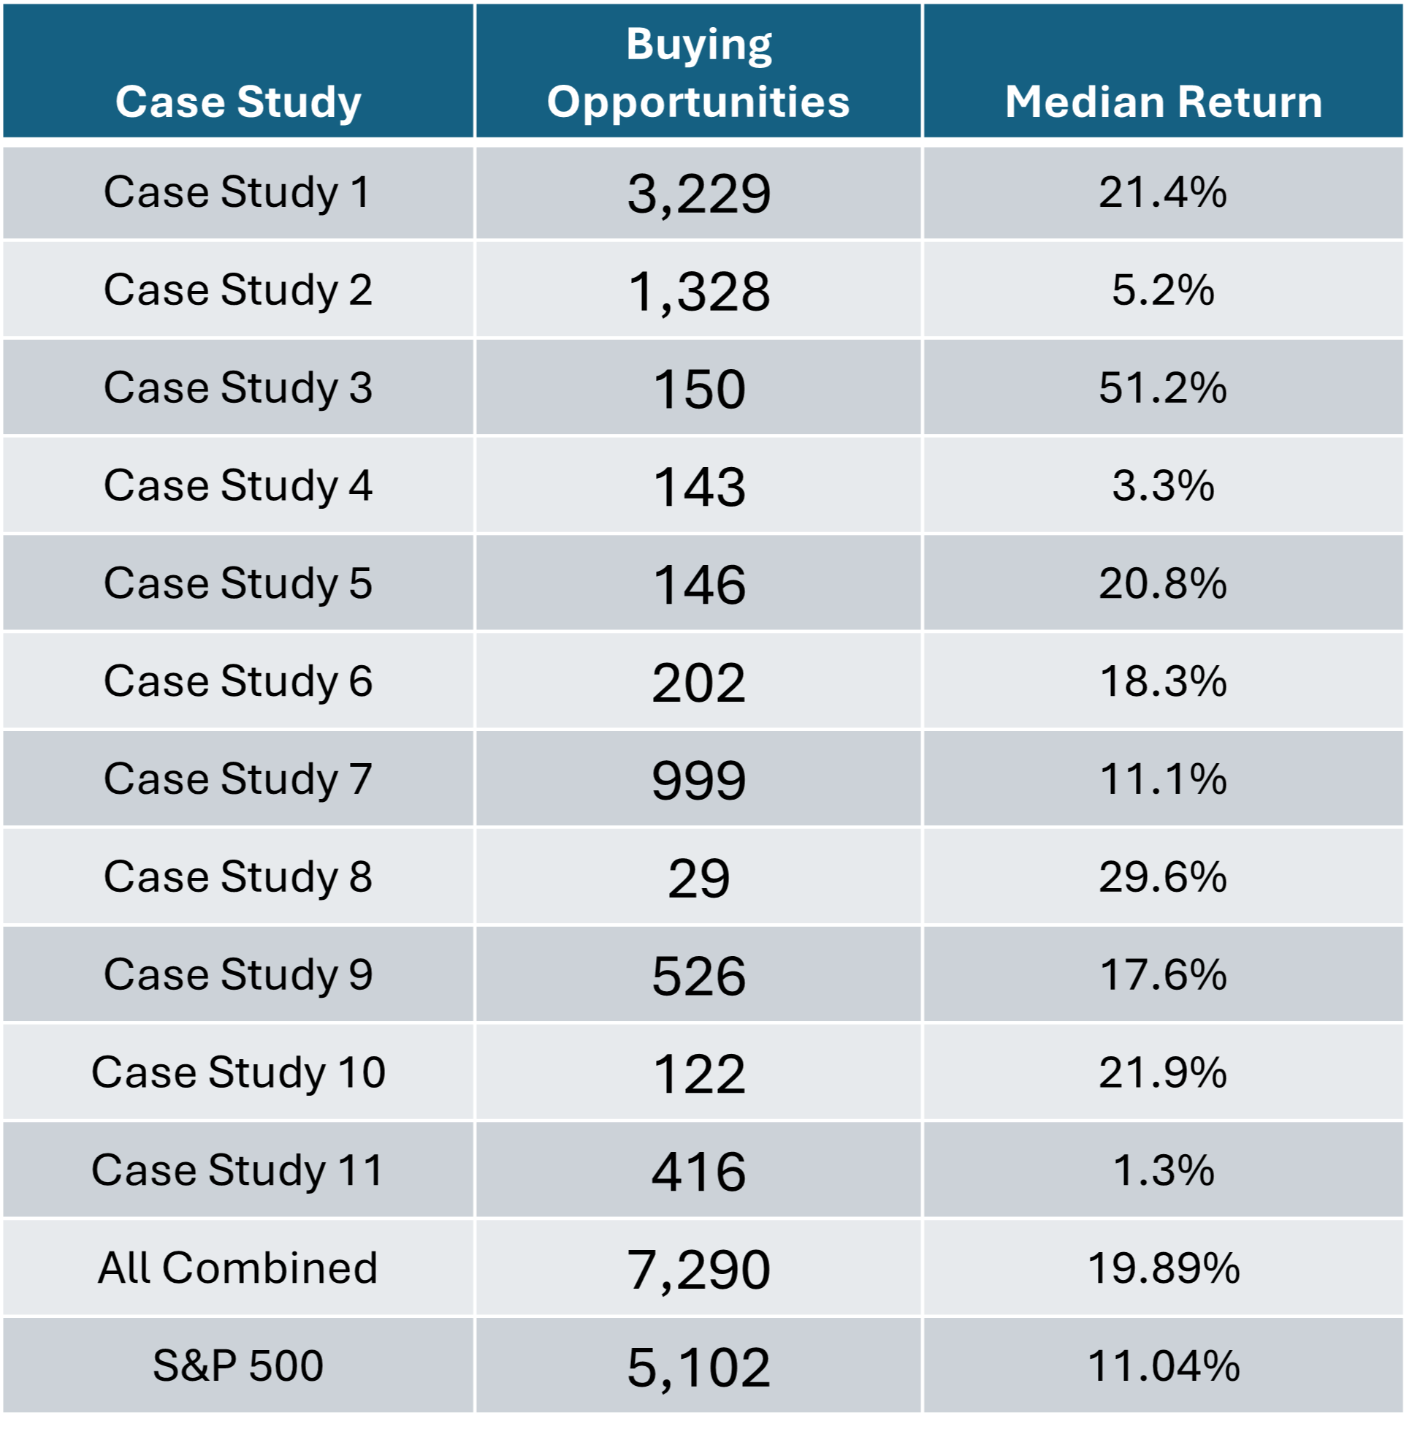
S&P 500 typical range (25th to 75th percentile): 8.55% - 11.79%
REAL Stocks typical range (same percentiles): 10.30% - 22.36%
Study trading days: 5,102
Buying opportunities: 7,290
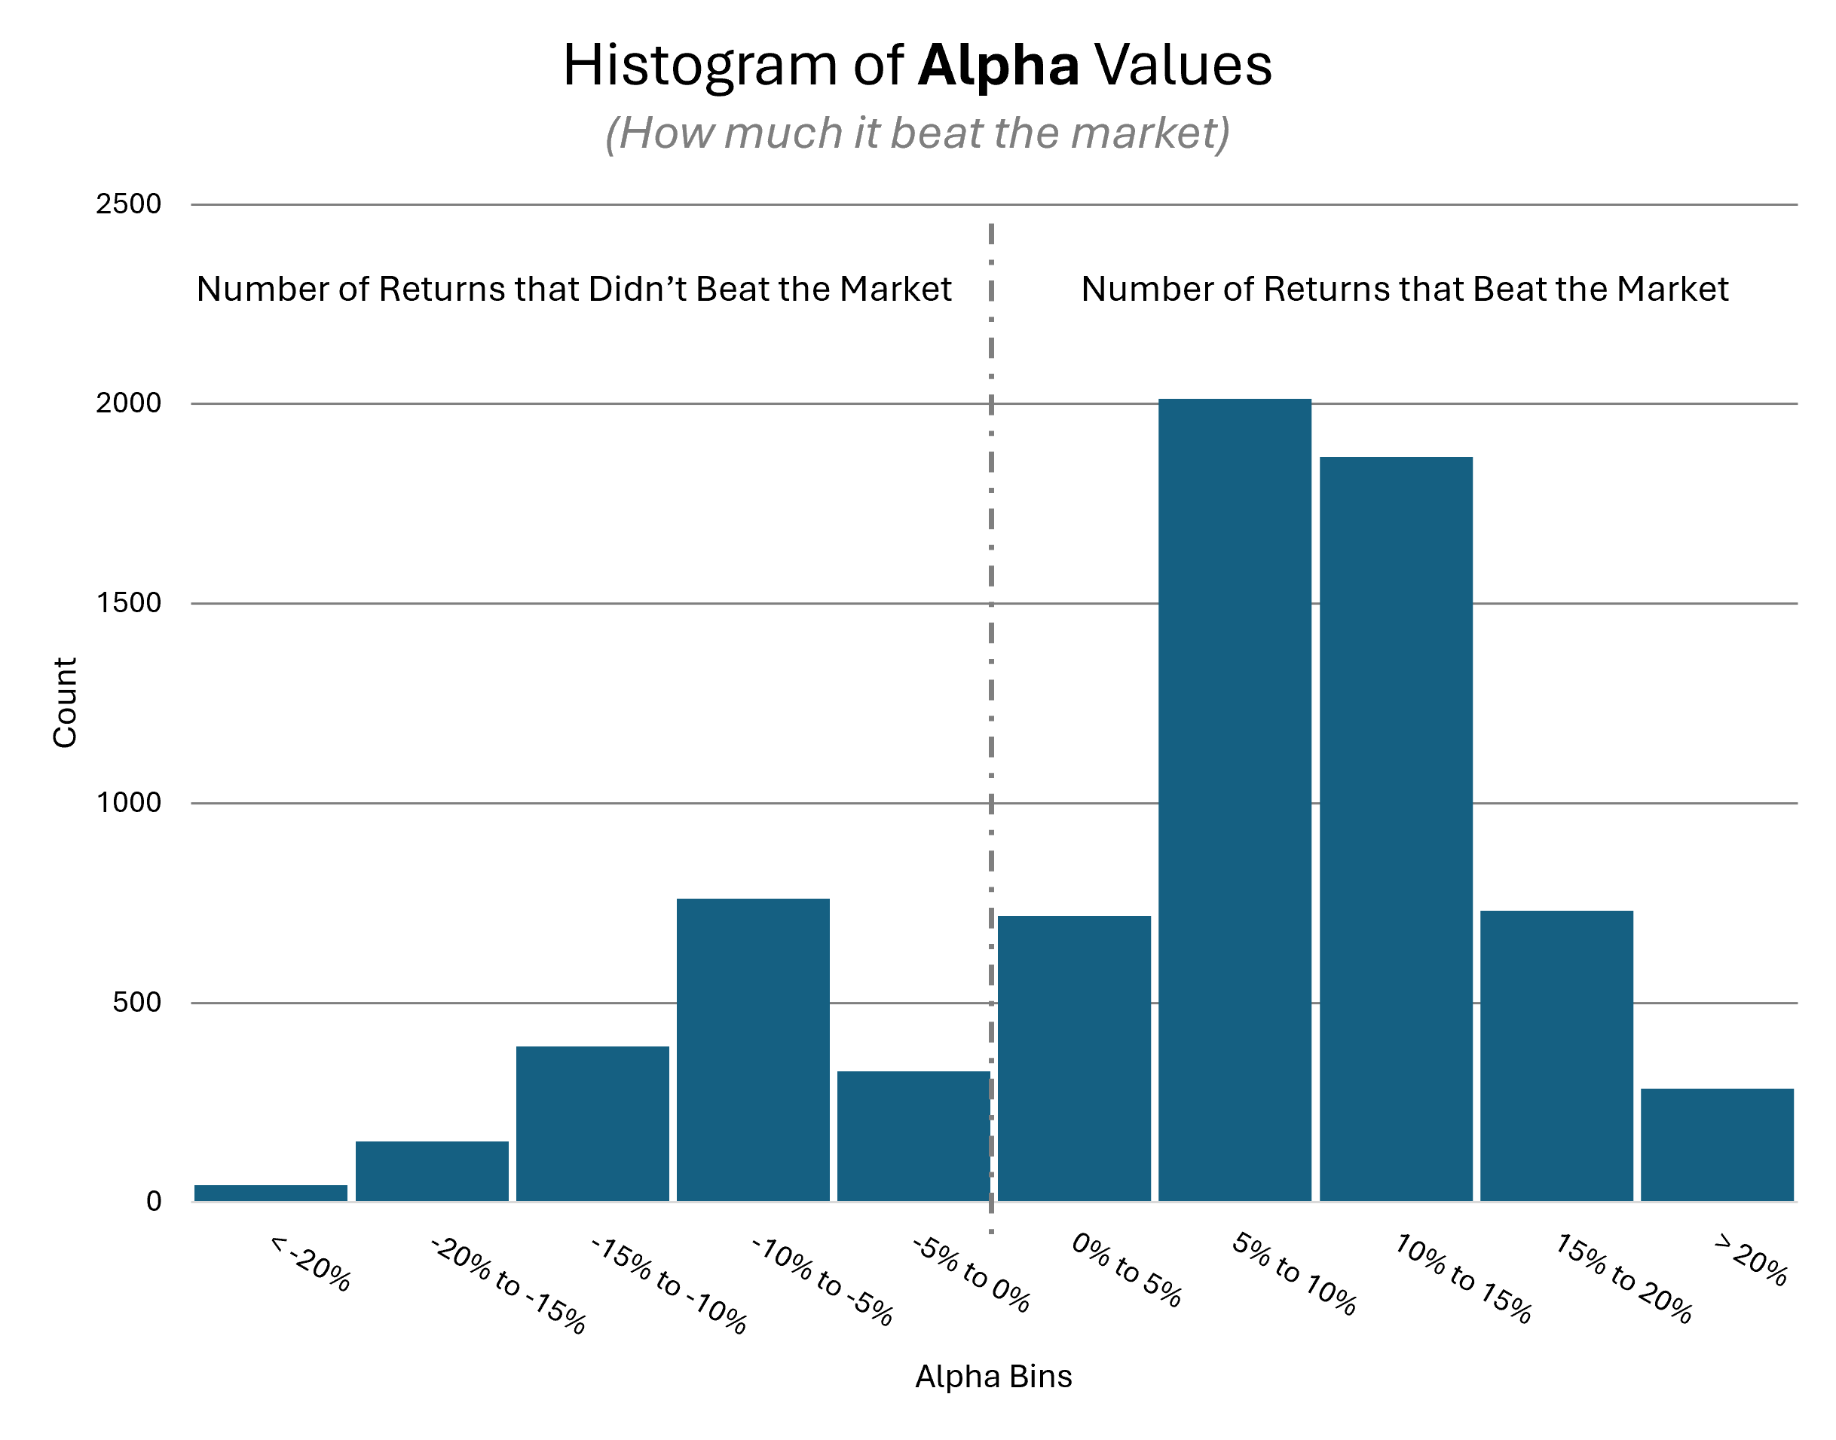
Buys that beat S&P500: 5,615
Percent that beat the market: 77%
Alpha = Strategy Return - S&P500 Return
Across all 11 REAL Stocks:
Average alpha overall: 6.49%
Average alpha when beating: 11.11%
Average alpha when losing: -9.00%
REAL Stock Case Study Conclusion
This case study shows that the REAL Stock Investing Strategy beats the market.
Some key points:
- The study was based on over 25 years of data
- Trades were not "cherry picked," but were based on repeatable, stringent REAL Stock Investing Strategy criteria
- Trades were made at various times and were not reliant on extreme market events
- More than 3 out of 4 trades beat the market
- Overall, the strategy beat the market by 6.49% on average
- Winning returns exceeded market returns by 11% on average
- Losing returns were only 9% less than market on average
- This means there is more upside than downside (asymmetric returns)
The REAL Stock Investing course explains this strategy, step-by-step, and reveals the company names from this case study.
If you'd like access to this course, click the button below to join the priority notification list.
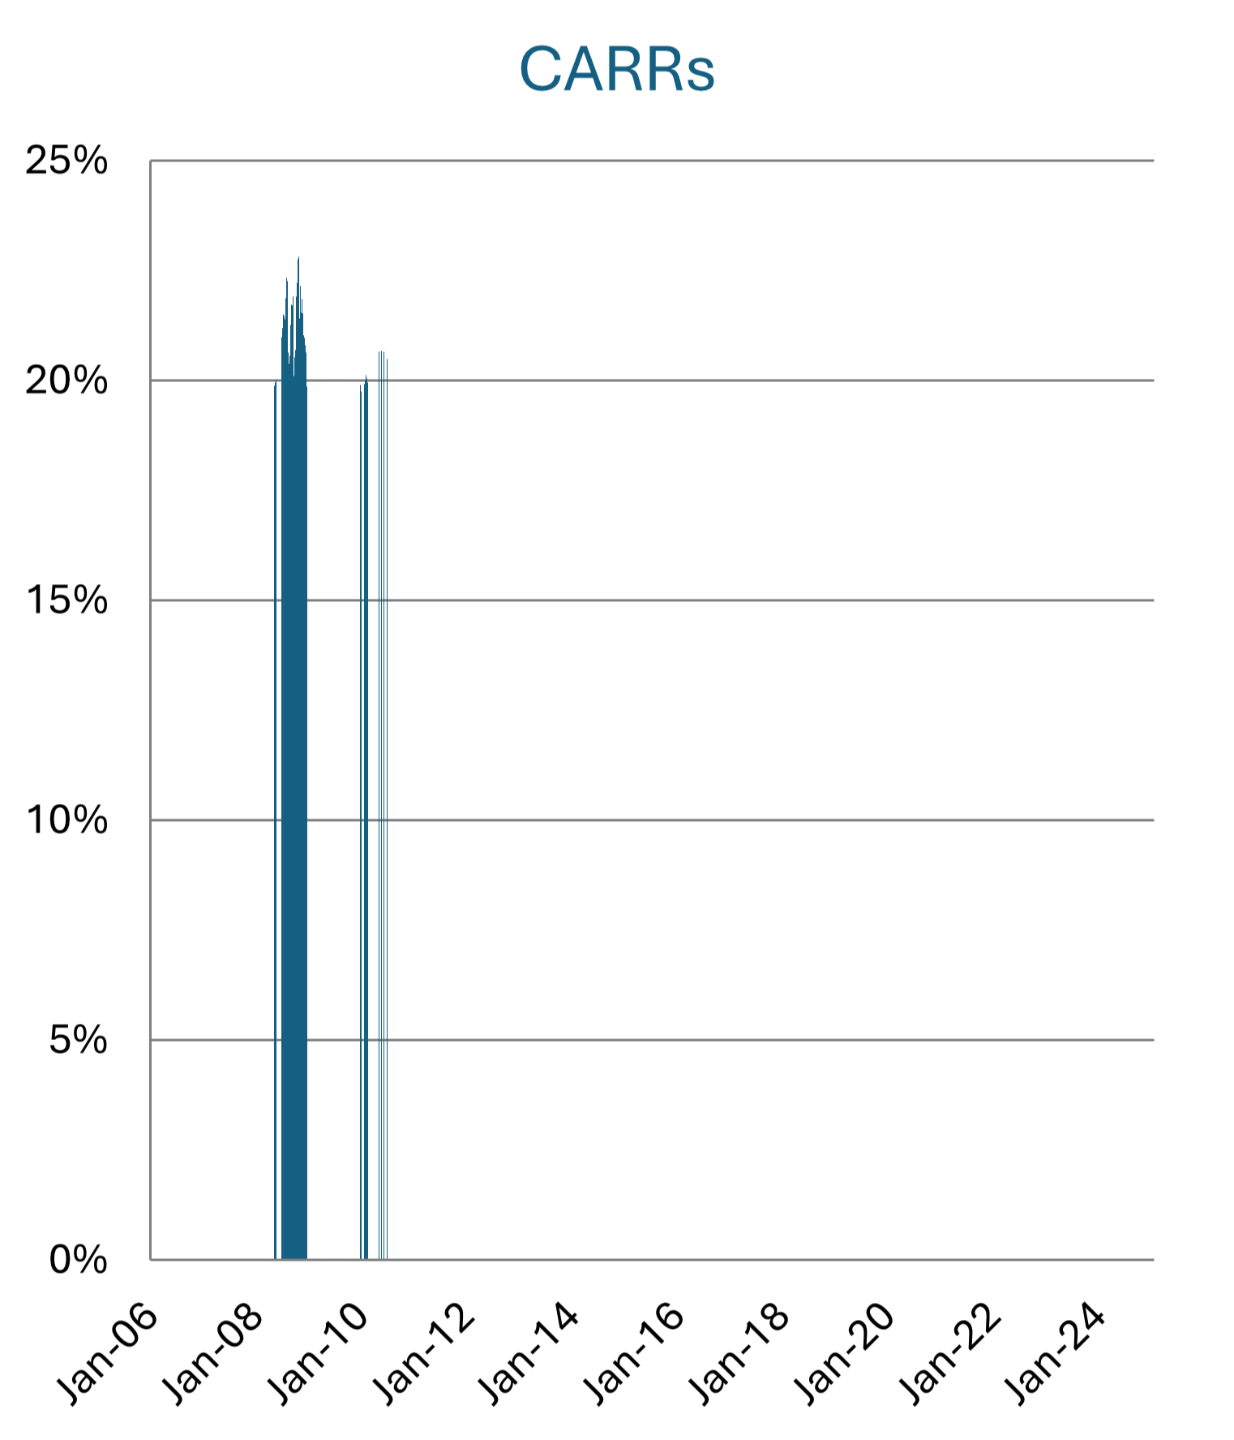
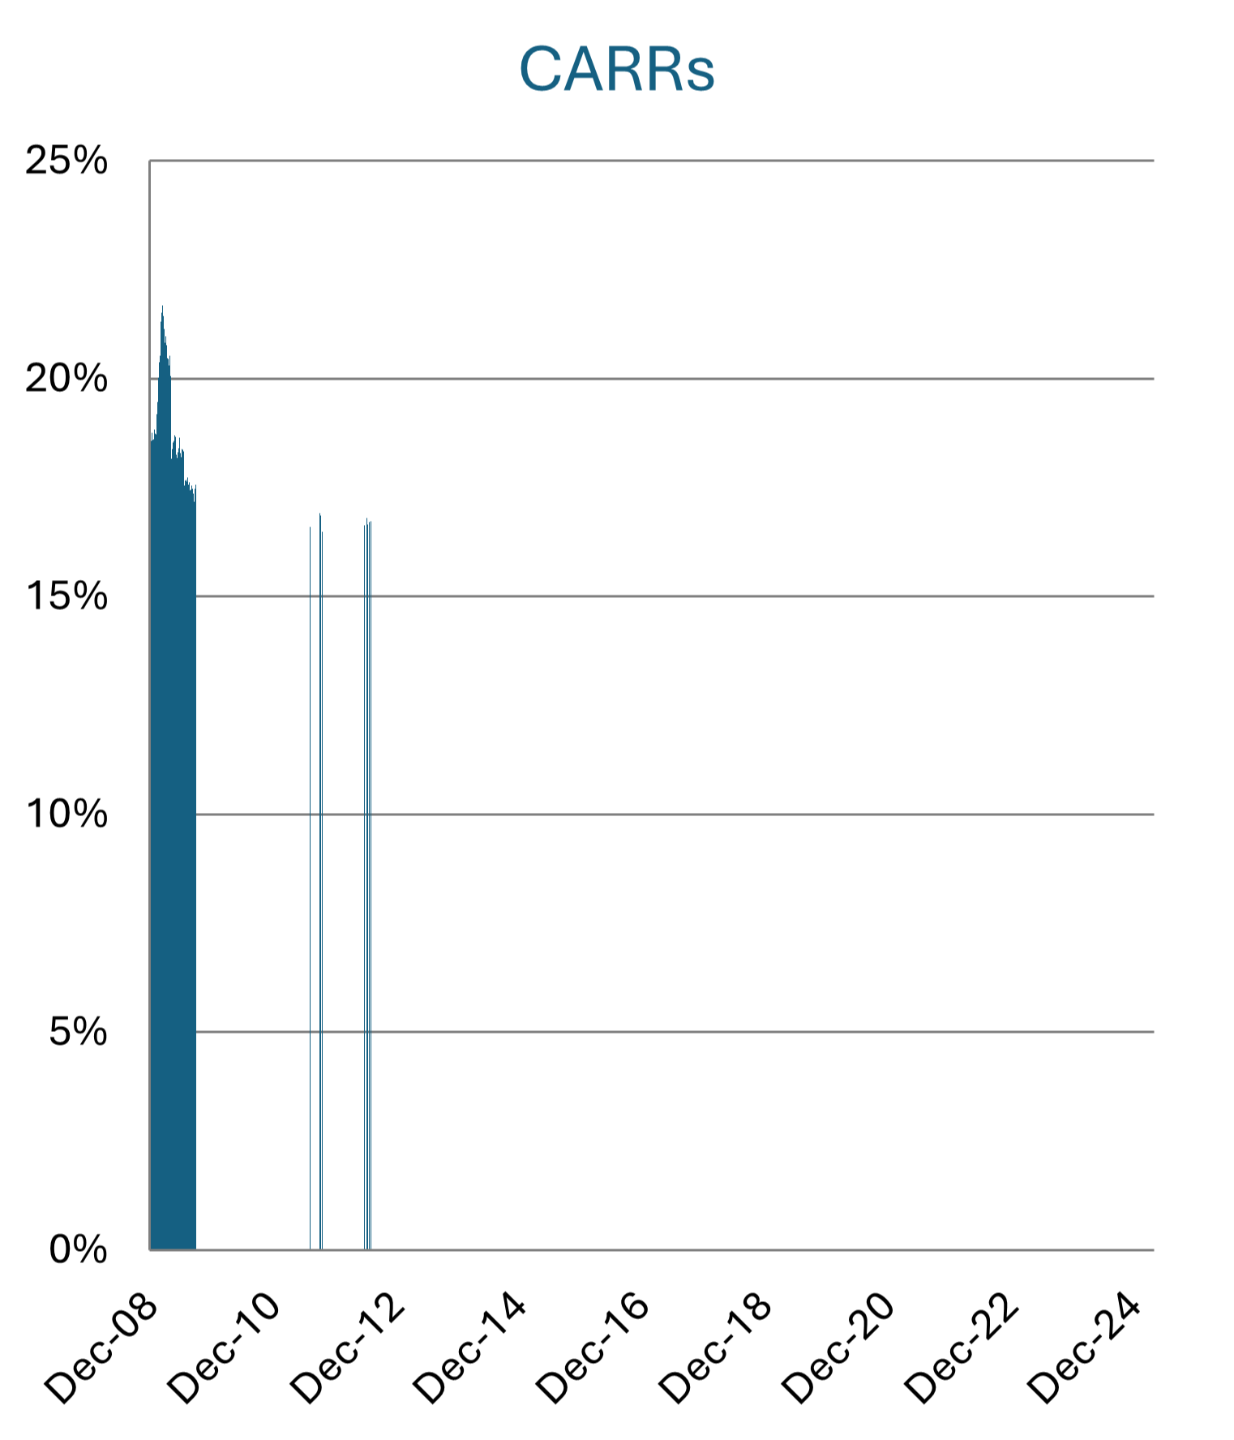
REAL Stock Case Study 1
Over 3,200 buying opportunities
Median Compounding Annual Return Rate 21.4%
This stock was part of the Portfolio Test
REAL Stock Case Study 2
Over 1,300 buying opportunities
Median Compounding Annual Return Rate 5.2%
This stock was part of the Portfolio Test
REAL Stock Case Study 3

150 Buying opportunities
Median Compounding Annual Return Rate 51.2%
REAL Stock Case Study 4
143 Buying opportunities
Median Compounding Annual Return Rate 3.3%
Note: All returns are based on the price at the end of the case study, which was low for this stock at the time, lowering returns. The price is expected to increase over the long-term, which will increase returns.
REAL Stock Case Study 5
146 Buying opportunities
Median Compounding Annual Return Rate 20.8%
This stock was part of the Portfolio Test
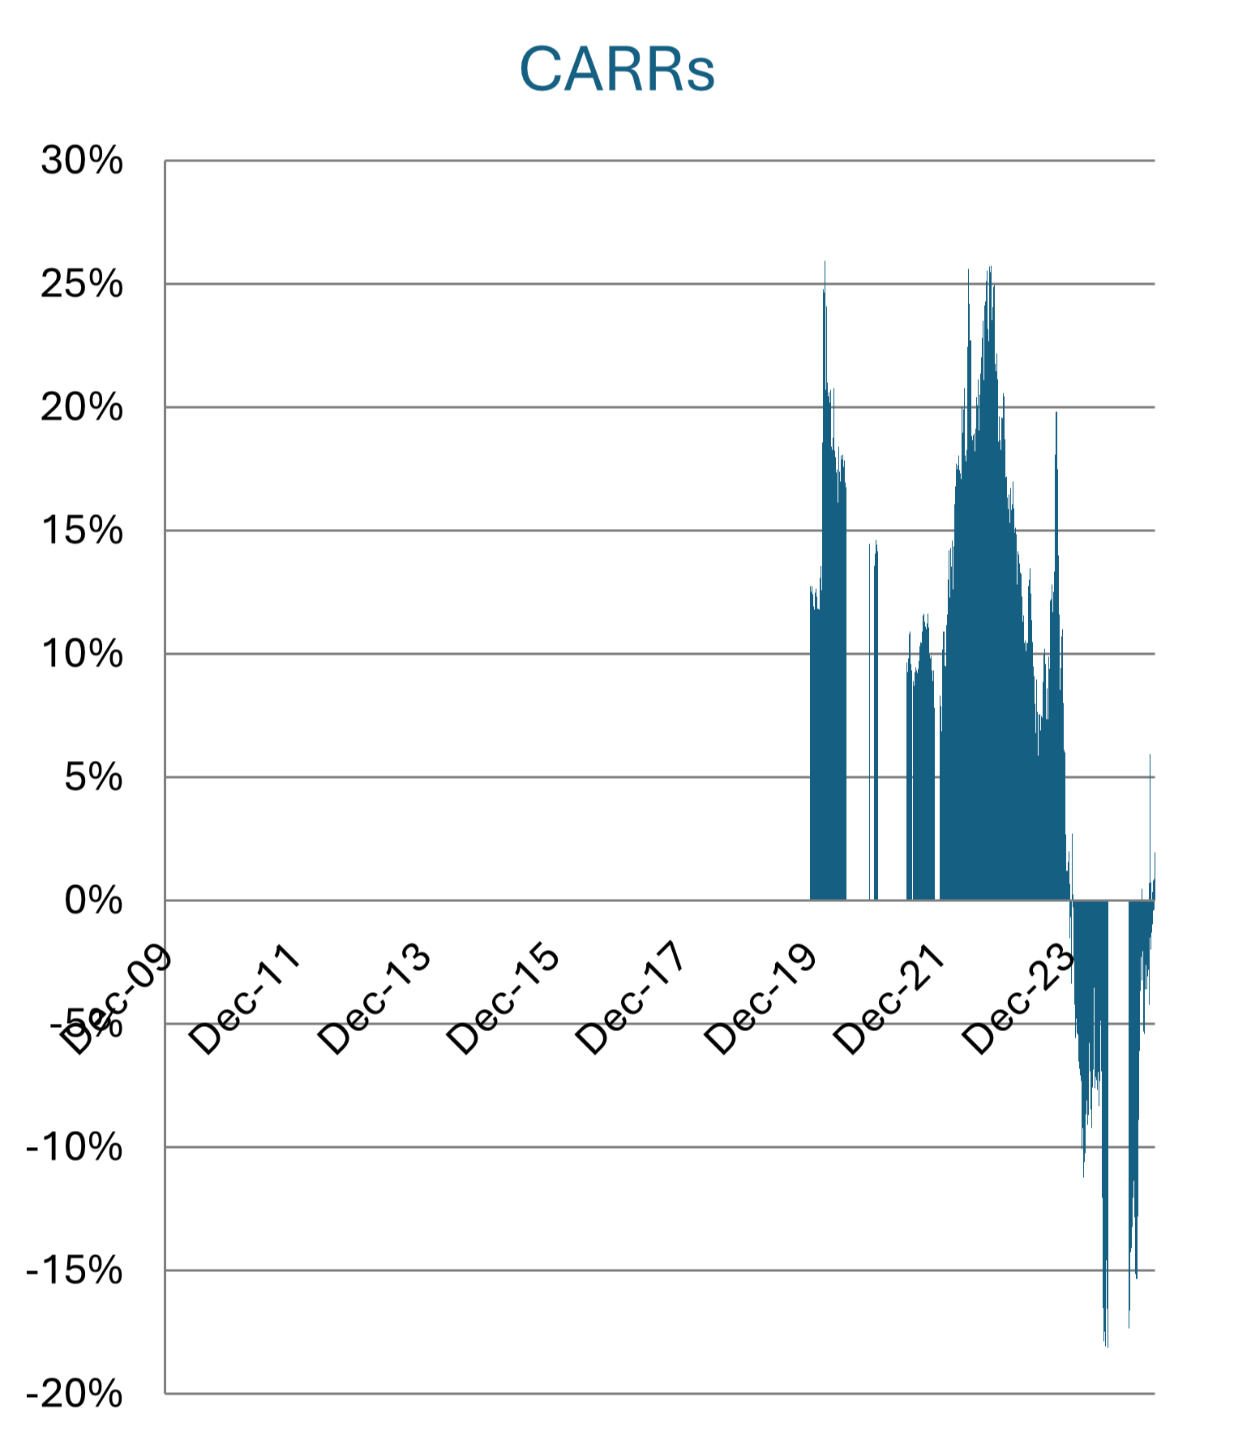
REAL Stock Case Study 6
202 Buying opportunities
Median Compounding Annual Return Rate 18.3%
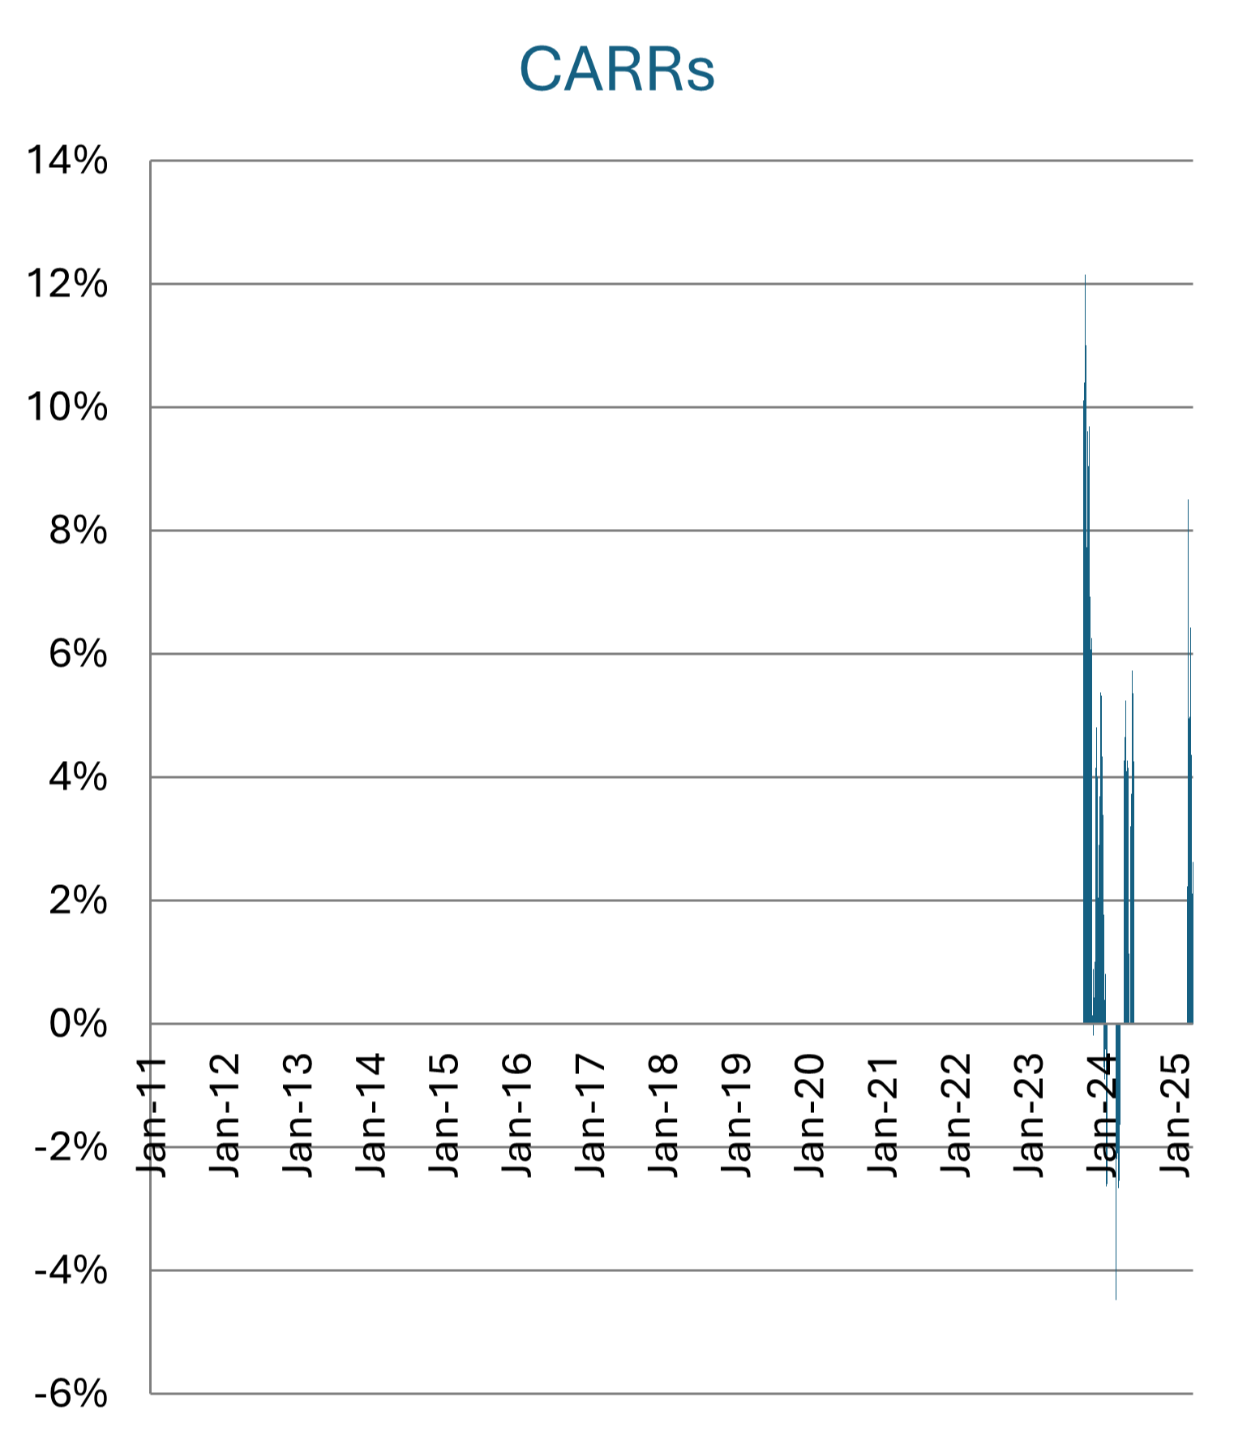
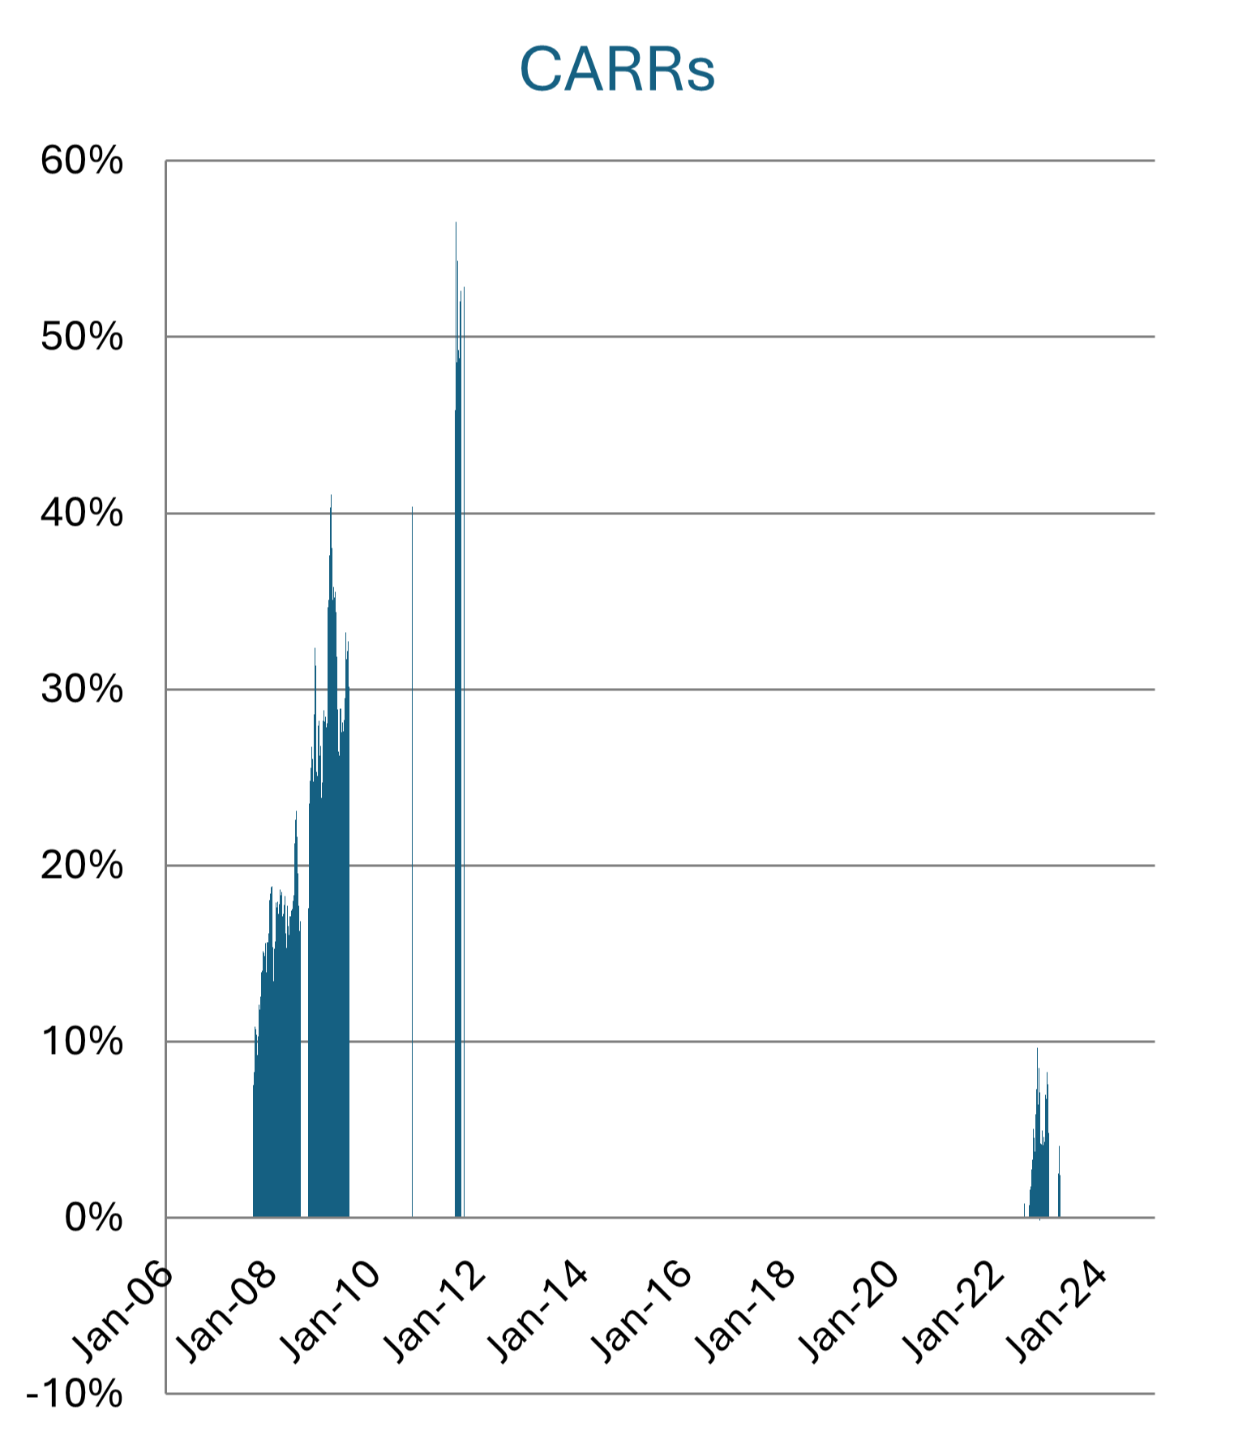
REAL Stock Case Study 7
999 Buying opportunities
Median Compounding Annual Return Rate 11.1%
Note: All returns are based on the price at the end of the case study, which was low for this stock at the time, lowering returns. The price is expected to increase over the long-term, which will increase returns.
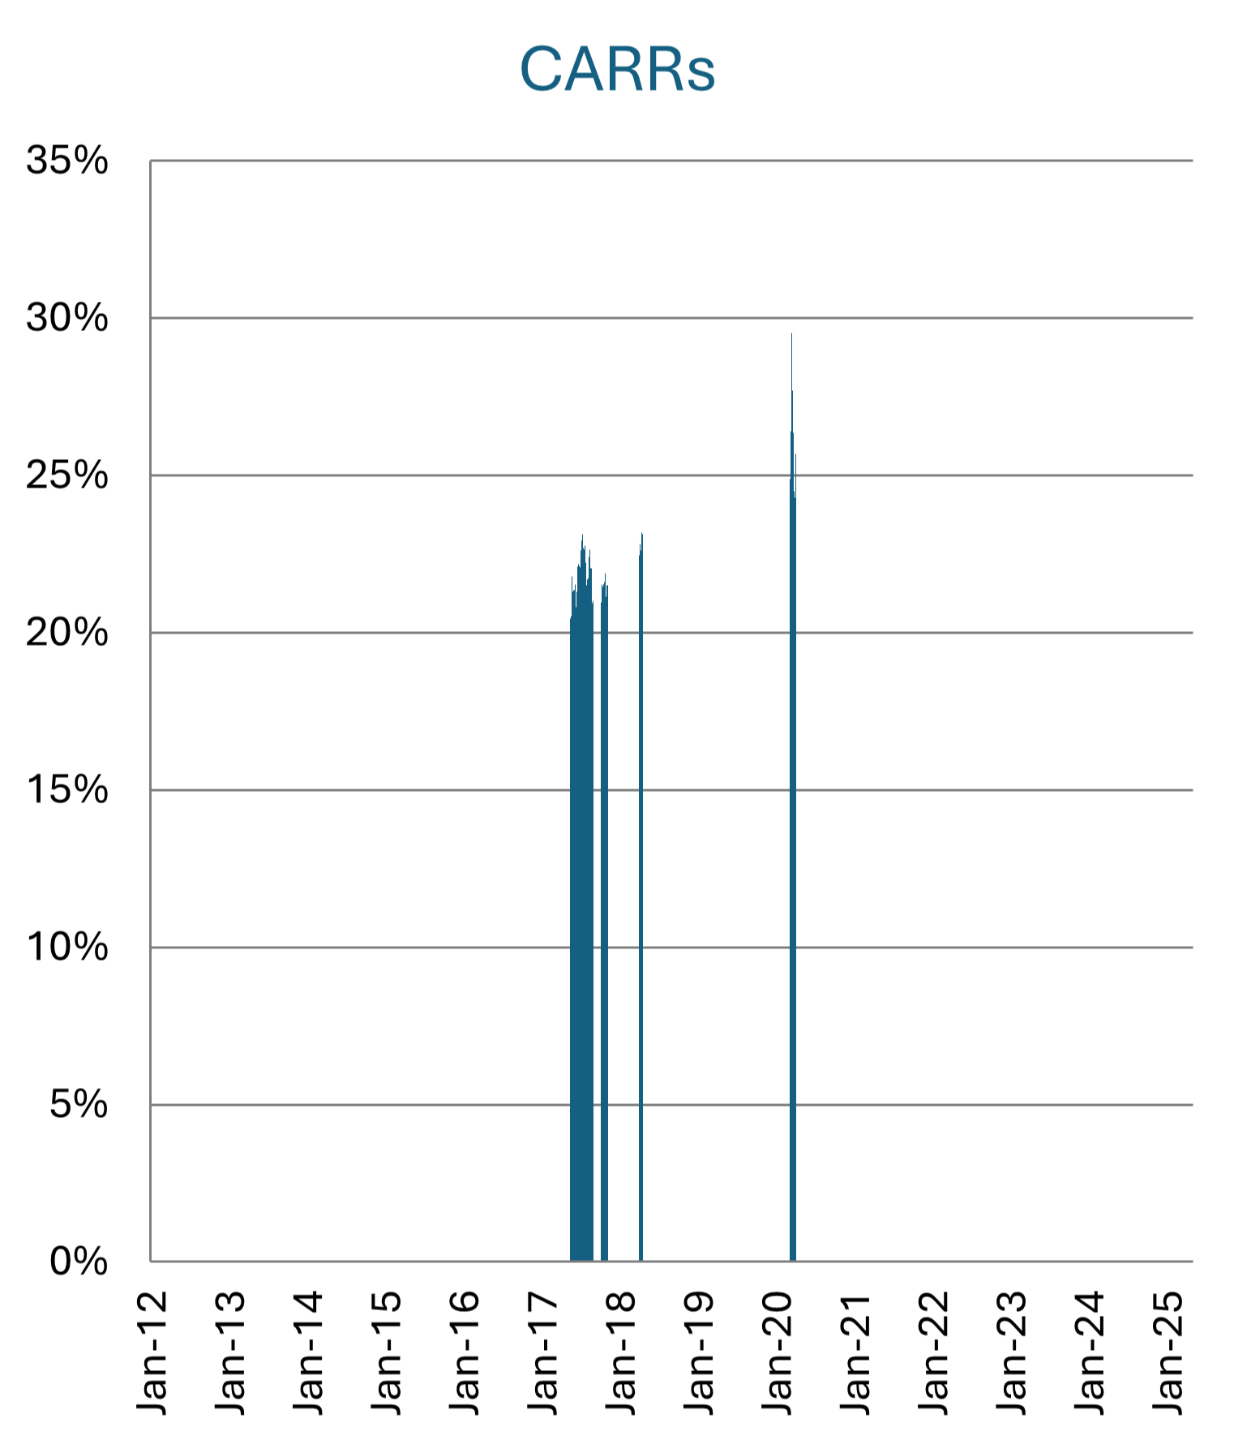
REAL Stock Case Study 8
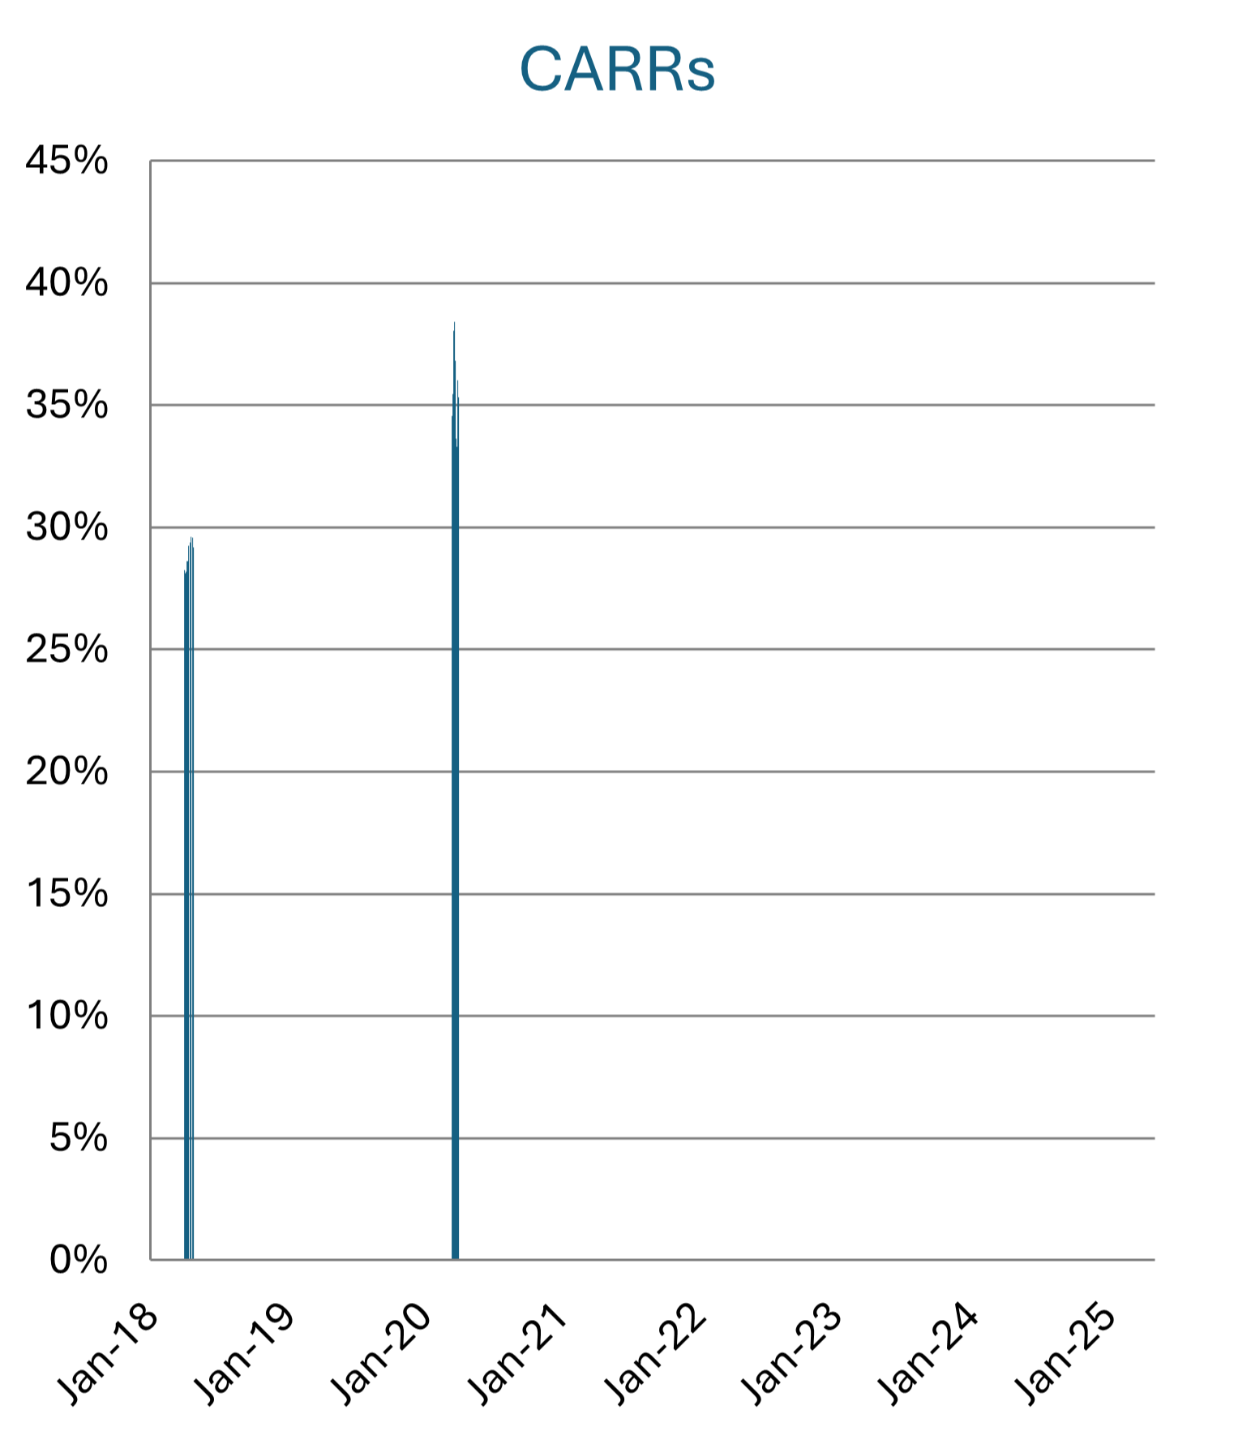
29 Buying opportunities
Median Compounding Annual Return Rate 29.6%
REAL Stock Case Study 9
526 Buying opportunities
Median Compounding Annual Return Rate 17.6%
This stock was part of the Portfolio Test
REAL Stock Case Study 10
122 Buying opportunities
Median Compounding Annual Return Rate 21.9%
REAL Stock Case Study 11
416 Buying opportunities
Median Compounding Annual Return Rate 1.3%
Note: All returns are based on the price at the end of the case study, which was low for this stock at the time, lowering returns. The price is expected to increase over the long-term, which will increase returns.